![]()
Jubilee Venn Diagrams?
Current solo exhibition: 7 Feb - 23 March 2014, Grafton Regional Gallery, Grafton, NSW
And I have it all here in red, blue, green
In red, blue, green
You are my center when I spin away
Out of control on videotape, on videotape
- Thom Yorke, 02006
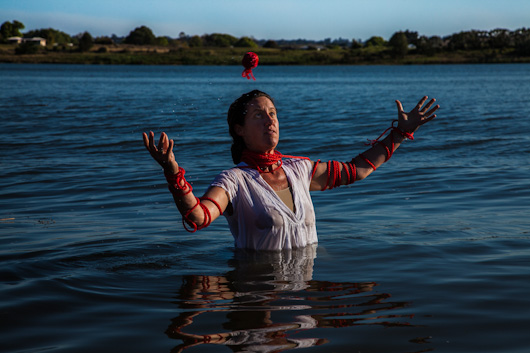
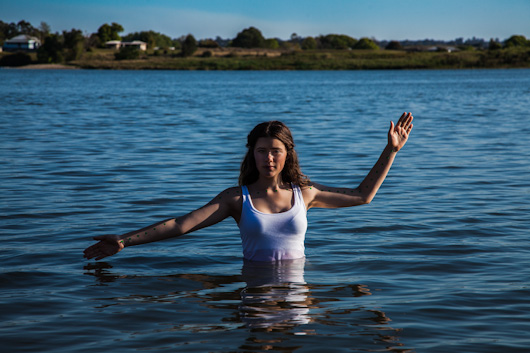
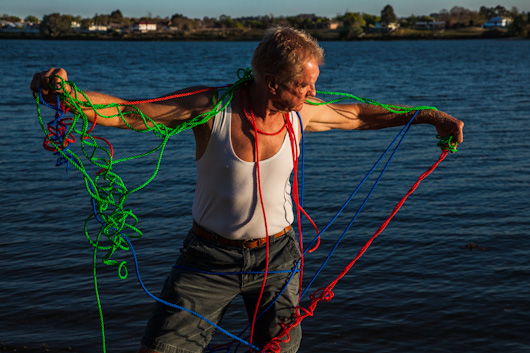
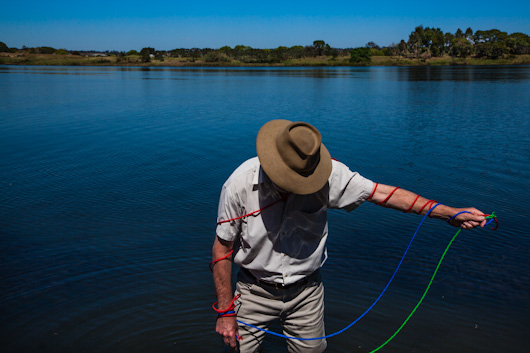
While weather seems tangible through our everyday sense of our immediate surroundings (such as touch, sight, smell) climate is intangibly perceived through cumulative measurement, analysis, and computation. Jubilee Venn Diagrams? interplays these seemingly tangible and intangible dimensions of climate change, through a photo- and video-portrait series of the human body animating diagrams of climate change trajectories.
To envisage climate change as visceral and embodied within the here and now of our lifetimes, the series interplays the domain of global climate (operating over eons, epochs and eras) with weather (operating at the local, here and now) by overlaying climate data on the human body (always local, always here and always now). As the bodies move through horizontal and vertical axes, they draw diagrams of climate data through the trajectories they trace: Red denotes global average temperature, Blue denotes sea level and Green denotes greenhouse gas concentration in the atmosphere.
In theme and variation on the stance of the Vitruvian man, these Cartesian diagrams draw out the evolution of the Anthropocene – wherein humans so shaped global geophysical processes that the Holocene can now be looked back on as a Past constellation of Red, Blue and Green clustered left and low on the Cartesian plane, seen from the Present: the vantage point at the centre of the screen/diagram/Virtruvian figure.
What remains to be seen is which Future trajectory we will traverse: in some portraits Red, Blue and Green remain within the scale of the human body. In other portraits, they supersede it, passing overhead. In others still, Red, Blue and Green excede the boundaries of the screen and diagram alltogether...

the calamity before the storm and jubilant vs jubilee
on the balance of probabilities and tangled up in blue (versus red versus green)

Carbon Sink and to Let it Be is to Let it Go
Previous group exhibition:
Perth Centre for Photography
UNCOVER Award - Finalists
Perth Centre for Photography
26 October - 6 December 2012
100 Aberdeen Street
Northbridge
Western Australia
Jubilee Venn Diagrams? was produced through an Artist Residency at Grafton Regional Gallery in Grafton in Sept-Oct 2012. The Media Release from Grafton Regional Gallery about the project is avaialble here. This Artist Residency was supported by Grafton Regional Gallery, Arts NSW, Grafton Shopping World and No.1 Duke Street.

![]()